Pennsylvania Study Links Fracking to Health Hazards in Fetuses, Infants, and Young Children Press Release by Joseph Mangana, Radiation and Public Health Project, July 26, 2015, EINPressWire
OCEAN CITY, NJ, USA, July 26, 2015 /EINPresswire.com/ — FOR IMMEDIATE RELEASE
Pennsylvania Study Links Fracking to Health Hazards in Fetuses, Infants, and Young Children
Ocean City, NJ – June 15, 2015 – In one of the first studies of its kind, Joseph J. Mangano of the Radiation and Public Health Project found disturbing links between hydraulic fracturing (fracking) and health effects in children younger than five years old.
In the report “Health Hazards to Fetuses, Infants, and Young Children in Heavily-fracked Areas of Pennsylvania,” funded by the Pittsburg Foundation, Mangano explains that as a relatively new technology in the landscape of natural gas extraction, fracking hasn’t been extensively studied with regards to health impacts on nearby residents. His study compares morbidity and mortality rates for several age groups living in eight heavily-fracked counties in the state with the same data in the rest of Pennsylvania. Heavily-fracked counties included in the study were Bradford, Washington, Tioga, Susquehanna, Lycoming, Greene, Westmoreland, and Fayette.
Mangano found that heavily-fracked counties have
13.9% greater infant mortality,
23.6% greater perinatal mortality,
3.4% more low-weight births,
2.4% more premature births, and
35.1% more cancer in children ages zero to four.
According to Mangano, “[This] information is only a start in refining the discussion about fracking’s impact on humans. Other studies must be conducted, on this and other geographic areas, disease categories, and age groups. As these develop, it is crucial that information such as this is disseminated to citizens and public leaders, leading to more informed discussion that will make future public policies that best protect the public’s health.”
Contact:
Joseph Mangano
email hidden; JavaScript is required
Executive Director, Radiation and Public Health Project
P.O. Box 1260
Ocean City, NJ 08226
609-399-4343
###
Joseph Mangana
Radiation and Public Health Project
609-399-4343
email us here
HEALTH HAZARDS TO FETUSES, INFANTS, AND YOUNG CHILDREN
IN HEAVILY-FRACKED AREAS OF PENNSYLVANIA by Joseph J. Mangano MPH MBA, Radiation and Public Health Project, June 1, 2015 Submitted to The Pittsburgh Foundation, Pittsburgh PA
TABLE OF CONTENTS
Executive Summary . . . . . . . . . . . . . . . . . . . . . . . . . . . . . . . . . . . 3
Introduction – The Rise of Fracking in Pennsylvania . . . . . . . . . . . . . . . . . . 4
Fracking’s Threat to Human Health . . . . . . . . . . . . . . . . . . . . . . . . . . . 7
Methods and Materials. . . . . . . . . . . . . . . . . . . . . . . . . . . . . . . . . . 8
Results
Infant/Perinatal Mortality. . . . . . . . . . . . . . . . . . . . . . . . . . . . . . . . . . 9
Low-Weight Births. . . . . . . . . . . . . . . . . . . . . . . . . . . . . . . . . . . . . 10
Premature Births. . . . . . . . . . . . . . . . . . . . . . . . . . . . . . . . . . . . . . . 11
Fetal Deaths. . . . . . . . . . . . . . . . . . . . . . . . . . . . . . . . . . . . . . . . . 12
Child Cancer Incidence Age 0-4. . . . . . . . . . . . . . . . . . . . . . . . . . . . . . . 13
Birth Defects. . . . . . . . . . . . . . . . . . . . . . . . . . . . . . . . . . . . . . . . . 14
Discussion. . . . . . . . . . . . . . . . . . . . . . . . . . . . . . . . . . . . . . . . . . 15
Appendices. . . . . . . . . . . . . . . . . . . . . . . . . . . . . . . . . . . . . . . . . 17
EXECUTIVE SUMMARY
Natural gas has been extracted from the ground for energy for many years. But in the past decade, a method of extraction called hydraulic fracturing has become the preferred method of extraction. This method, known as fracking, has raised questions about health and safety, as it releases large amounts of toxic chemicals, including greenhouse gases and radioactivity.
Few studies have appeared in medical journals on the effects of fracking to humans living near natural gas drilling wells. This report is an effort to present some basic public health measures on changes in morbidity and mortality rates in eight heavily-fracked Pennsylvania counties, compared to trends in the rest of the state. The focus is on health outcomes of fetuses, infants, and young children, and compare the most recent 5 or 6 years (when fracking was common) to the prior 4 to 6 years (before large-scale fracking). Major findings include:
1. The rise in infant mortality in heavily-fracked counties was 13.9% greater than other PA
2. The rise in perinatal mortality in heavily-fracked counties was 23.6% greater
3. The rise in low-weight births in heavily-fracked counties was 3.4% greater
4. The rise in prematurity (gestation <32 weeks) in heavily-fracked counties was 12.4% greater
5. The rise in cancer incidence age 0-4 in heavily-fracked counties was 35.1% greater
Some of these changes were statistically significant, and others were of borderline significance. In all categories but child cancer, increases were greater in the four heavily-fracked northeast counties than they were in the four southwest counties.
The information is only a start in refining the discussion about fracking’s impact on humans. Other studies must be conducted, on this and other geographic areas, disease categories, and age groups. As these develop, it is crucial that information such as this is disseminated to citizens and public leaders, leading to more informed discussion that will make future public policies that best protect the public’s health.
Health Hazards to Fetuses, Infants, and Young Children in Heavily-Fracked Areas of Pennsylvania
I. Introduction – The Rise of Fracking in Pennsylvania. The state of Pennsylvania has traditionally been one of the most highest-ranked U.S. states in terms of producing oil, coal, and natural gas. Pennsylvania’s oil boom of the late 19th century has long peaked, as has coal production.
But the trend in natural gas production has recently been quite different. The underground Marcellus Shale formation has been estimated to have 500 trillion cubic feet of natural gas under rocks. A substantial portion of the Marcellus Shale is in Pennsylvania, along with New York, Ohio, and West Virginia.
Coal and nuclear have long been the 1st and 2nd most common sources of electricity in the U.S. But in recent years, new coal and nuclear plants have stopped being built, while aging plants are closing. The contribution to the energy mix from these sources has dropped, and numerous predictions indicate this trend will only accelerate.
In the middle of the first decade of the 21st century, two developments rapidly accelerated the production of natural gas in Pennsylvania. One was the introduction of horizontal drilling wells, and the other was the process of hydraulic fracturing, commonly known as fracking.
Fracking is a process that breaks up rocks that contain natural gas. A fluid mixture of chemicals, sand, and water injects this mixture using high pressure, allowing natural gas to flow more easily and be captured more efficiently. Gas companies have discovered the ability of fracking to produce more gas, and have used the technique in rapidly growing numbers for about the past decade in Pennsylvania and other areas of the U.S.
Just under half (32) of the 67 Pennsylvania counties have drilling wells for natural gas. But even among these counties, the great concentration of wells is in two areas of the state. One is the southwestern area just below Pittsburgh, and the other is the northeast part on the border of New York State. Table 1 shows that eight counties, four contiguous counties each in the southwest and northeast, account for 81.4% of the wells in Pennsylvania.
Table 1
Counties with Most Natural Gas Drilling Wells, Pennsylvania
County Wells Area of PA 2013 Population
Bradford 1142 NE 62,316
Washington 808 SW 208,206
Tioga 792 NE 42,463
Susquehanna 734 NE 42,286
Lycoming 706 NE 116,754
Greene 559 SW 37,838
Westmoreland 239 SW 362,437
Fayette 226 SW 134,999
Total 8 Counties 5206 1,007,299
Total PA 6391 12781296
% PA in 8 Cos. 81.4% 7.9%
Source: D’Amico C, DeBelius D Detrow S, Stiles M. Shale Play: Natural Gas Drilling in Pennsylvania,www.stateimpact.npr.org/pennsylvania/drilling/, 2011 (wells). U.S. Census Bureau, www.census.gov. There are 67 counties in Pennsylvania.
The four contiguous counties in northeast Pennsylvania are Bradford, Lycoming, Susquehanna, and Tioga. The contiguous counties in southwest Pennsylvania are Fayette, Greene, Washington, and Westmoreland. Selected demographic patterns in the eight counties are compared to those in other Pennsylvania in Table 2:
Table 2
Selected Demographic Characteristics
8 Counties with Most Drilling Wells vs. PA
Characteristic 8 PA Counties Total PA
2013 Population 1,007,299 12,781,296
2013 % Black 3.0 11.5
2013 % Hispanic 1.2 6.3
2013 % White non-Hispanic 93.8 78.4
2009-13 % Foreign Born 1.4 6.0
2009-13 % High School Graduate* 89.5 88.7
2009-13 % Bachelors or Higher* 21.6 27.5
2009-13 % Below Poverty 12.5 13.3
* Of adults age 25 or older. Source: U.S. Bureau of the Census,www.census.gov
There are some demographics that would suggest the eight counties are at lower risk for disease. These include a lower poverty rate, a slightly higher percent of high school graduates, and a lower percent of foreign born (presumably with some language barriers). Finally, there is a much lower local percent of blacks and Hispanics, who often have higher disease rates than non-Hispanic whites. The local percent of the population who graduated from college is lower, the only one of the listed demographics to suggest a higher health risk (less proficient at understanding good health habits and using the health system). But since these patterns have likely not changed much over the past decade, it is acceptable to compare morbidity and mortality for the total population combined between the two areas.
It is no surprise that the counties with the most drilling wells in Pennsylvania also account for the greatest amount of natural gas production. For example, Table 3 shows that the same eight counties produced 89.0% of the “unconventional” natural gas in the state in the first half of 2013. (Unconventional means that the gas was found in highly compact rock, and likely produced through fracking). The state produced over 1.4 trillion cubic feet of gas in that half year, or nearly 3 million a year – a figure that has grown since.
Table 3
Counties with Greatest Unconventional Gas Production
Pennsylvania, January-June 2013
County Production
Bradford 330,880,227
Washington 115,819,775
Tioga 110,146,683
Susquehanna 302,607,079
Lycoming 184,453,827
Greene 154,706,330
Westmoreland 32,021,333
Fayette 21,135,138
Total 8 Counties 1,251,770,392
Total PA 1,405,714,729
% PA in 8 Cos. 89.0%
Source: FracTracker Alliance, www.fractracker.org/…/pa-releases-unconventional-productio…/. Only 32 of 67 counties in Pennsylvania have gas production. Numbers in thousands of cubic feet. Wyoming County (NE PA) has 60,129,108 cubic feet (x000).
The soaring use of fracking in recent years can be expressed in several ways. One of these is the trend in number of drilled unconventional wells. Table 4 shows that from 2005 to 2012, the number of these wells rose from 8 to 1360 (after peaking at 1974 wells in 2011). Of these, about 80% were located in the eight counties. It is feasible, then, to pinpoint the start of large-scale fracking in Pennsylvania at about the year 2007.
Table 4
Number of Drilled Unconventional Wells
Heavily Fracked PA Counties vs. Other PA
County 2005 2006 2007 2008 2009 2010 2011 2012
Bradford 1 2 2 24 160 377 398 161
Washington 5 19 45 66 101 167 157 196
Tioga 0 0 0 15 124 276 274 122
Susquehanna 0 1 2 33 88 125 205 192
Lycoming 0 0 5 12 23 120 305 208
Greene 0 2 14 67 101 104 121 108
Westmoreland 1 0 4 33 39 49 59 42
Fayette 0 2 6 20 57 44 54 47
Total 8 Cos. 7 26 78 270 693 1262 1573 1076
Total PA 8 36 115 335 819 1611 1974 1360
% PA in 8 Cos. 88 72 68 81 85 78 80 79
Source: Frac Tracker Alliance. www.fractracker.org/…/drilled-unconventional-wells-in-pa-b…/, 2013.
II. Fracking’s Threat to Human Health. Fracking involves the release of greater amounts of toxic chemicals into air and water than traditional natural gas extraction. In addition to various greenhouse gases, large amounts of natural radiation (radon, radium, uranium, and thorium) are dislodged from underground sites and released into the atmosphere.
Accordingly, scientists and citizens have voiced health concerns. However, there is virtually no research in journals on fracking and ACTUAL changes in disease and death rates. Several recent journal articles noted this lack of studies. For example, a short commentary in a recent Journal of the American Medical Association stated:
“There are few scientific findings on the effects of fracking on the environment and animal and human health.” Mitka M. Rigorous Evidence Slim for Determining Health Risks from Natural Gas Fracking. JAMA, May 23, 2012; Vol. 307, No. 20, pp. 2135-2136.
Only 5 articles (referenced at the end of this report) that assess actual morbidity and mortality rates close to natural gas extraction sites are in the “Pub Med” literature of the National Library of Medicine. Results are mixed (below):
Link w/ natural
Author, Year Topic Location gas exposure?
Mills et al, 1984 Testicular cancer (workers) U.S. Yes (significant)
Siemiatycki et al, 1994 Bladder cancer (workers) Canada Yes (not significant)
Colquhoun et al, 2010 Total and colorectal cancer Canada No (significant)
Frysek et al, 2013 Childhood cancer Pennsylvania Yes (not significant)
McKenzie et al 2014 Birth defects Colorado Mixed*
* (neural tube defects yes/significant; congenital heart defects yes/significant; oral cleft no/not significant; pre-term births no/significant; low-weight births no/significant)
The current public discussion over fracking health risk features strong opinions. But opinions cannot be based on scientific facts until they are made available. It is critical for officials and citizens to be informed of actual evidence of risk, or a lack thereof.
While there are many categories of disease and death that can be analyzed in a longitudinal study (that tracks rates over time), perhaps the first analyses should be conducted on the youngest humans, namely the fetus, infant, and young child. Any environmentally-caused health problems in the very young are the result of a recent insult, while health problems in adults can be a result of a much earlier exposure with a long lag period before the disease is diagnosed.
Thus, this report will compare recent trends in disease and death rates among the youngest in heavily-fracked Pennsylvania counties with other Pennsylvania counties. The expectation is that increases in the fracked counties will exceed the others.
III. Materials and Methods. The first issue to be addressed is the selection of counties into the fracked and non-fracked categories. As presented, 8 of 67 Pennsylvania counties account for the lion’s share of the natural gas drilling wells and gas production in the state. While wells exist in another 24 counties, the total number is much lower than that of the most heavily-fracked areas. Metropolitan Philadelphia, which accounts for a substantial portion of the state’s population, has none. Thus, comparisons of health trends in the eight most-fracked counties and the rest of the state has a sound basis as “exposed” and relatively “unexposed” areas.
The next methodological area to be addressed is that of the periods before and after fracking became common. This is an inexact decision, as fracking has gradually increased for nearly a decade. The closest approximation to creating these categories is to assign the years before and after 2005 or 2006. At this writing (March 2015), data for many fetal, infant, and child disease and death rates are available until 2012.
Another issue is the selection of health measures to be studied. Because they are readily available on the internet, the following conditions will be analyzed:
1. Infant mortality < 1 year
2. Perinatal mortality < 28 days
3. Fetal mortality, gestation > 20 weeks
4. Premature births, gestation < 32 weeks
5. Low weight births, weight < 2500 grams (5.5 lbs.)
6. Cancer incidence, diagnosed age 0-4
7. Birth defects
The measure used for the “before fracking” and “after fracking” periods will be the Standard Mortality Ratio or Standard Incidence Ratio (SMR or SIR). An SMR or SIR is the local (8 county) rate vs. the rate in all other Pennsylvania counties. For example, if the local death rate is 10.0 per 100,000, and the rate for other Pennsylvania is 5.0, the SMR is 2.00, or 10 divided by 5). If the local incidence rate is 2.40 and the state rate is 4.80, the SMR is 0.50, or 2.40 divided by 4.80.
Sources of each of these measures are the Pennsylvania Department of Health and the U.S. Centers for Disease Control and Prevention. Data are presented on the Internet, giving the analysis a transparency that encourages others to duplicate the findings in the report.
IV. Results.
A. Infant/Perinatal Mortality. Probably the most commonly used descriptor of a society’s health is infant mortality, defined as the number of deaths to infants under one year per 1000 live births. A variation of infant mortality is perinatal mortality, defined as the number of deaths to infants under 28 days after birth per 1000 live births. Statistical information on infant/perinatal deaths have been routinely captured by local and state health departments for nearly a century. Fewer than 1% of all U.S. babies die before their first birthday.
Tables 5 and 6 show the changes in infant and perinatal mortality for the eight exposed counties and the rest of Pennsylvania, using 2003-2006 and 2007-2012 as “before” and “after” periods.
Table 5
Infant Mortality Trends, 2003-2012
Heavily Fracked PA Counties vs. Other PA
Deaths < 1 Year Total Live Births Deaths/1000 Births Std. Mortality Ratio
Area 2003-06 2007-12 2003-06 2007-12 2003-06 2007-12 2003-06 2007-12 % Ch. SMR
4 NE Cos. 63 109 11693 16789 5.39 6.49 .731 .905 +23.8%
4 SW Cos. 185 283 29210 42221 6.33 6.70 .859 .934 + 8.7%
Tot 8 Cos. 248 392 40903 59010 6.06 6.64 .822 .936 +13.9% p<.07
Other PA 4007 5817 543543 810982 7.37 7.17 —- —-
Source: http://www.portal.state.pa.us/portal/server.pt…, Pennsylvania Department of Health. Infant mortality defined as number of deaths under age 1 per 1000 live births.
Table 6
Perinatal Mortality Trends, 2003-2012
Heavily Fracked PA Counties vs. Other PA
Deaths < 28 Days Total Live Births Deaths/1000 Births Std. Mortality Ratio
Area 2003-06 2007-12 2003-06 2007-12 2003-06 2007-12 2003-06 2007-12 % Ch. SMR
4 NE Cos. 34 74 11693 16789 2.91 4.41 .553 .884 +59.9 p<.01
4 SW Cos. 125 195 29210 42221 4.28 4.62 .814 .927 +13.9
Tot 8 Cos. 159 269 40903 59010 3.89 4.56 .740 .915 +23.6 p<.02
Other PA 2856 4042 543543 810982 5.25 4.98 —- —-
Source: http://www.portal.state.pa.us/portal/server.pt…, Pennsylvania Department of Health. Perinatal mortality defined as number of deaths under age 28 days per 1000 live births.
The infant death rate for the eight counties increased, compared to all other Pennsylvania (SMR .822 to .936, or +13.9%). This means that the local rate was 17.8% below other Pennsylvania in 2003-2006, but only 6.4% below in 2007-2012. This increase was borderline statistical significant at p<.07 (significance is defined as anything below p<.05).
The four highly-fracked counties in northeast Pennsylvania had a greater increase in infant death SMR (+23.8%), compared to +8.7% in southwest Pennsylvania. Neither achieved statistical significance. All areas have infant death rates below the state, but the gap has closed since 2006.
The perinatal SMR for the eight counties increased +23.6%, from .740 to .915, significant at p<.02. The increase in the four northeast counties was 59.9% (significant at p<.01), compared with +13.9% in the southwest.
These data are taken from the Pennsylvania Department of Health web site. The U.S. Centers for Disease Control and Prevention also present infant/perinatal mortality on its web site, and report slightly different numbers of infant/perinatal deaths and live births. However, the results are similar; tables for CDC-reported statistics are given in the appendices.
B. Low-Weight Births. Another measure of health for infants is the proportion of births born underweight. The standard definition of an underweight birth is one under 2500 grams, or 5 ½ pounds. Around 8% of U.S. births are born at low weight. Like infants who die in their first year or month of life, underweight births often represent an insult in the fetal period that causes the baby not to gain weight (and often, to be born prematurely).
Table 7 provides statistical information on changes in low-weight births from 2001-06 to 2007-12 among births in the eight highly-fracked counties and all other 59 Pennsylvania counties.
Table 7
Low-Weight Birth Trends, 2001-2012
Heavily Fracked PA Counties vs. Other PA
Births < 2500 g Total Live Births % Births <2500 g Std. Incidence Ratio
Area 2001-06 2007-12 2001-06 2007-12 2001-06 2007-12 2001-06 2007-12 % Ch. SIR
4 NE Cos. 1192 1238 17458 16789 6.83 7.37 .831 .890 +7.1%
4 SW Cos. 3343 3305 43945 42221 7.61 7.83 .927 .945 +1.9%
Tot 8 Cos. 4535 4543 61403 59010 7.39 7.70 .899 .930 +3.4%
Other PA 66459 67152 809388 810982 8.21 8.28 —- —-
Source: http://www.portal.state.pa.us/portal/server.pt…, Pennsylvania Department of Health. Low weight births defined as the percent of live births under 2500 grams (5 ½ pounds).
Similar to infant and perinatal deaths, incidence of underweight births has been traditionally lower in the highly-fracked areas, compared to the rest of Pennsylvania. From 2001-2006 to 2007-2012, the Standard Incidence Ratio for the eight counties rose +3.4%, from .899 to .930, a statistically insignificant change. Similar to infant/perinatal mortality, the northeast fracked counties had a greater SIR increase than in the southwest (+7.1% vs. + 1.9%, both not significant).
C. Premature Births. A measure of infant health related to low-weight births is that of premature births, or low-gestation births. When a child is born prematurely, there is a reason(s) why it failed to thrive in the womb. Prematurity is associated with a greater risk of death, birth defects, low weight, and developmental problems.
The standard definition for a premature birth is less than 39 weeks, or 9 months. As the CDC collects data on premature births for each week under this number, it is necessary to define prematurity for this study. The rate of premature births under 32 weeks is somewhat under 1%, or roughly equal to the infant death rate, and it will be used here.
Table 8 provides changes from 2003-2006 to 2007-2012 in low-gestation births, for the Pennsylvania counties with the largest amount of fracking in the state, compared to the rest of the state. The source is the CDC, as the state health department does not include gestation data on its web site. Since CDC only includes the most-populated counties on its web site, only 4 of the 8 heavily-fracked counties are included, namely Fayette, Lycoming, Washington, and Westmoreland, representing about 80% of the births in the eight fracked counties.
Table 8
Births with Gestation <32 Weeks, Trends, 2003-2012
Heavily Fracked PA Counties vs. Other PA
Births <32 Wk Ges Births Known Ges <32 Wk/1000 Births Std. Incidence Ratio
Area 2003-06 2007-12 2003-06 2007-12 2003-06 2007-12 2003-06 2007-12 % Ch. SIR
4 Fracked Cos. 207 325 32855 47427 6.30 6.85 .752 .845 +12.4%
Other PA 4592 6694 547951 825174 8.38 8.11 —- —-
Source: U.S. Centers for Disease Control and Prevention (http://wonder.cdc.gov). Only Fayette, Lycoming, Washington, and Westmoreland Counties are included.
The SIR of the proportion of births with gestation under 32 weeks increased +12.4%, from .752 to .845 from 2003-2006 to 2007-2012, based on 325 premature births in the latter six years. The change fell short of statistical significance. Similar to other measures of fetal and infant health, the local rate has been below the state rate, but the gap has closed since 2006. Because the four counties make up about 80% of the births in the eight-county fracked area, it is highly likely it represents the same pattern for all eight counties.
D. Fetal Deaths. Public health departments have also collected data on fetal deaths, also known as stillbirths, for many years. Although a substantial number of pregnancies end up in miscarriage, mostly in the first trimester, the standard definition of fetal deaths are those over 20 weeks of gestation. For years, there have been concerns that fetal deaths have been widely underreported or sporadically reported, and thus any analysis must be done cautiously.
The Pennsylvania Department of Health had only collected and made public county-specific fetal deaths until 2011 as of this writing (March 2015). Comparisons of 2003-2006 (or 2001-2006) with succeeding years failed to show any consistent patterns of fetal deaths. However, splitting the data into four-year groups (2001-2004, 2005-2008, and 2009-2011) is another way to present information on fetal deaths, shown in Table 9.
Table 9
Fetal Death Trends, 2001-2011
Heavily Fracked PA Counties vs. Other PA
% Change SMR
Area Fetal Deaths Live Births Deaths/1000 Births Std. Mort. Ratio 2001-04/2009-11
4 NE Cos.
2001-2004 91 11647 7.81 .794
2005-2008 97 11264 8.61 .862
2009-2011 71 8445 8.41 .854 +7.6
4 SW Cos.
2001-2004 272 29500 9.22 .937
2005-2008 249 28891 8.62 .863
2009-2011 199 20937 9.50 .962 +2.7
Tot 8 Cos.
2001-2004 363 41147 8.82 .897
2005-2008 346 40155 8.62 .863
2009-2011 270 29382 9.19 .930 +3.7
Other PA
2001-2004 5271 535905 9.84 —-
2005-2008 5521 552840 9.99 —-
2009-2011 3956 400481 9.88 —-
Source: http://www.portal.state.pa.us/portal/server.pt…, Pennsylvania Department of Health. Fetal deaths defined as any fetus stillborn over 20 weeks gestation.
The fetal death Standard Mortality Ratio for the eight fracked counties increased +3.7% (.897 to .930) from 2001-2004 to 2009-2011, based on 297 deaths in the latter three years. The increase was not statistically significant. The increase in the northeast counties was greater than in the southwest counties (+7.6% vs. 2.7%); neither was significant.
Although these patterns – steady SIR/SMR increases, greater in northeast Pennsylvania – are similar to other fetal and infant health measures, the findings should be accepted with caution, as the reliability of the reported data has been questioned due to under-reporting.
E. Child Cancer Incidence, Age 0-4. Another means of studying potential harm from chemical exposure to fracking is to examine the incidence (new cases) of cancer diagnosed in young children. Since 1985, the Pennsylvania Cancer Registry has made annual numbers of new cancer cases available, by county, age (5 year groups), race, and sex. The latest year available is 2012.
The youngest age group for which diagnosed cases are available is 0-4. Scientists agree that many, if not all cancers diagnosed at this age are an outcome of an aberration in development during pregnancy, with several years latency between the insult and diagnosis. Personal habits often suggested as contributors to adult cancers, such as smoking, diet, and obesity are not pertinent to pre-school children.
The annual risk of cancer in children age 0-4 is about 20 or 25 cases per 100,000 children, a relatively low rate compared to adults. Most types of cancer do not occur in young children; over half are either leukemia or brain/central nervous system tumors.
If 2005 or 2006 marks the start of the era of heavy fracking, changes in cancer among young children would not be expected for at least 1 or 2 years. Thus, data from a pre-fracking baseline of 2003-2007 will be used, and compared to following five-year period 2008-2012. The source is the Pennsylvania Cancer Registry, which is part of the state health department.
Table 10 presents the change in 0-4 cancer incidence Standard Incidence Ratio for the eight fracked counties, compared to the other 59 counties in the state.
Table 10
Cancer Incidence Age 0-4 Trends, 2003-2012
Heavily Fracked PA Counties vs. Other PA
Cancer Cases 0-4 Population 0-4 Cases/100000 Pop Std. Incidence Ratio
Area 2003-07 2008-12 2003-07 2008-12 2003-07 2008-12 2003-07 2008-12 % Ch. SIR
4 NE Cos. 16 18 73281 72875 21.83 24.70 .887 .996 +12.3%
4 SW Cos. 43 60 191422 184125 22.46 32.59 .912 1.314 +44.1% p<.06
Tot 8 Cos. 59 78 264523 257000 22.30 30.35 .906 1.224 +35.1% p<.07
Other PA 824 837 3346892 3375982 24.62 24.79 —- —-
Sources: http://www.portal.state.pa.us/portal/server.pt…, Pennsylvania Cancer Registry, Pennsylvania Department of Health (cancer cases). U.S. Centers for Disease Control and Prevention (http://wonder.cdc.gov), populations.
The child cancer 0-4 SIR for the eight counties rose +35.1%, from .906 to 1.224, borderline significant at p<.07. This means the local rate jumped from 9.4% below to 22.4% above the state. Child cancer is the only indicator in this report for which the current rate is greater than the other Pennsylvania counties. A total of 78 cancer cases were diagnosed in the most recent five years.
The four southwest counties had the higher SIR increase (44.1%, borderline significant at p<.06). The SIR rose from .912 to 1.314, meaning the most recent child cancer 0-4 incidence in that area is 31.4% above other PA counties. The four northeast counties had a smaller (+12.3%) increase in SIR.
F. Birth Defects. Another measure of fetal/infant health is the rate of birth defects. While there are many types of these anomalies, only five are presented on the Internet by CDC. They include Anencephaly, Cleft Lip/Palate, Down Syndrome, Omphalocele/Gastroschisis, and Spina Bifida/Meningocele. These five are relatively infrequent, producing small numbers on the county level. Moreover, CDC has only made data from 2007-2013 available, and thus no before-and-after comparison of heavy use of fracking can be made. Pennsylvania state officials do not make any birth defect data available, due to concerns about breaking patient confidentiality if only 1 case per year per county per defect is reported.
V. Discussion.
The advent of large-scale fracking as a means of in Pennsylvania and other states has added considerable amounts of toxic chemicals into the environment, including various greenhouse gases and radiation. While potential health consequences of fracking has been become a national issue, very little research on health trends among affected populations has been conducted.
This report looks at one heavily-fracked state (Pennsylvania) and focuses on the two areas with the greatest concentrations of natural gas drilling wells employing fracking. The two areas total eight counties and are located in the southwest and northeast portions of the state. Changes in health in these counties will be compared with the other 59 counties in Pennsylvania.
The focus of the health trends over time will be various indicators of fetal and infant health. The very young are most susceptible to the harmful effects of environmental radiation, so any unusual patterns in morbidity or mortality would show up quickest in these groups.
Morbidity and mortality ratios (local vs. state) in the periods before and after large-scale fracking are compared.
The results of the report are as follows:
1. Ratios increased almost uniformly in both the southwest and northeast portions of the state for all measures of fetal and infant health.
2. For most health measures the increases were greater in northeast Pennsylvania than in the southwest portion
3. For most health measures, local rates are less than state rates, but the gaps are closing over time
4. Some of the increases were statistically significant or of borderline significance
The information presented in this report support the hypothesis of a link between exposure to toxic chemicals released in fracking and increased risk of disease and death. While it is virtually impossible to estimate a “dose” to a community from chemicals generated by fracking, it is clear that residents of the eight most-fracked counties received far greater exposures than those in the rest of Pennsylvania.
Uses of the data are multiple. The first and perhaps the most important one is that results should be disseminated to shareholders, including citizens, citizen groups, public officials, health officials, media, and gas companies. The discussion of fracking’s effects need to continue and be evidence-based as much as possible, so that public policies can best protect the public’s health.
Further studies are, of course, merited. This report has only examined eight counties in one state. Other areas of analysis include persons in
– These eight counties other than fetuses and infants
– Other Pennsylvania counties with fracking operations
– Other states that engage in large-scale fracking
– Other measures of health than those used here
Perhaps the largest obstacle to obtaining a reliable means of analyzing the link between exposure to fracking’s toxic chemicals and health is the lack of reliable data. Some have estimated relative exposures, but nobody has yet established a comprehensive method. Still other obstacles are involved, such as exposure to natural gas plants and compressor stations, which also give off harmful chemicals. Still, even while struggling with estimates of doses, health studies of fracking’s effects should continue in greater numbers.
The author wishes to thank The Pittsburgh Foundation and the Henry Wallace Foundation for their support of this project.
REFERENCES:
Colquhoun A, et al. An investigation of cancer incidence in a First Nations Community in Alberta, Canada, 1995-2006. Chronic Diseases of Canada, September 2010;30(4):135-140.
Frysek J et al. Childhood cancer incidence in Pennsylvania counties in relation to living in counties with hydraulic fracturing sites. Journal of Occupational and Environmental Medicine, July 2013;55(7):796-801.
McKenzie LM et al. Birth outcomes and maternal residential proximity to natural gas development in rural Colorado. Environmental Health Perspectives April 2014;122(4):412-417.
Mills PK et al. Testicular cancer associated with employment in agriculture and oil and natural gas extraction. Lancet, January 28, 1984; 1(8370):207-210.
Siemiatycki J et al. Occupational risk factors for bladder cancer: results from a case-control study in Montreal, Quebec, Canada. American Journal of Epidemiology, December 15, 1994;140(12):1061-1080.
Appendix 1
Infant Mortality Trends, 2003-2012
Heavily Fracked PA Counties vs. Other PA
Deaths < 1 Year Total Live Births Deaths/1000 Births Std. Mortality Ratio
Area 2003-06 2007-12 2003-06 2007-12 2003-06 2007-12 2003-06 2007-12 % Ch. SMR
4 NE Cos. 65 105 11576 17047 5.62 6.16 .734 .844 15.0%
4 SW Cos. 186 285 29858 43099 6.23 6.61 .815 .906 11.2%
Tot 8 Cos. 251 390 41434 60146 6.06 6.48 .792 .888 12.1%
Other PA 4067 5866 532027 803586 7.64 7.30 —- —-
Source: U.S. Centers for Disease Control and Prevention (http://wonder.cdc.gov).
Appendix 2
Perinatal Mortality Trends, 2003-2012
Heavily Fracked PA Counties vs. Other PA
Deaths < 28 Days Total Live Births Deaths/1000 Births Std. Mortality Ratio
Area 2003-06 2007-12 2003-06 2007-12 2003-06 2007-12 2003-06 2007-12 % Ch. SMR
4 NE Cos. 36 69 11576 17047 3.11 4.05 .571 .798 +39.8% p<.06
4 SW Cos. 126 195 29858 43099 4.22 4.52 .775 .892 +15.1%
Tot 8 Cos. 162 264 41434 60146 3.91 4.39 .717 .866 +20.8% p<.04
Other PA 2898 4076 532027 803586 5.45 5.07 —- —-
Source: U.S. Centers for Disease Control and Prevention (http://wonder.cdc.gov). Perinatal mortality defined as number of deaths under age 28 days per 1000 live births.
[Compare to the belittling, dismissive, shoddy and biased 2015 AER health study in the Lochend, Alberta:
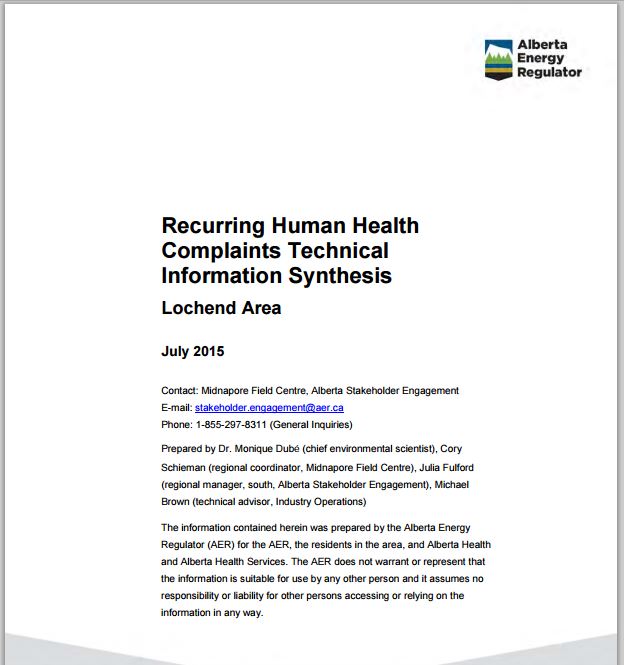
Recurring Human Health Complaints Technical Information Synthesis, Lochend Area
July 2015
Contact: Midnapore Field Centre, Alberta Stakeholder Engagement
E-mail: email hidden; JavaScript is required
Phone: 1-855-297-8311 (General Inquiries)
Prepared by Dr. Monique Dubé (chief environmental scientist), Cory
Schieman (regional coordinator, Midnapore Field Centre), Julia Fulford
(regional manager, south, Alberta Stakeholder Engagement), Michael
Brown (technical advisor, Industry Operations)
Refer also to:
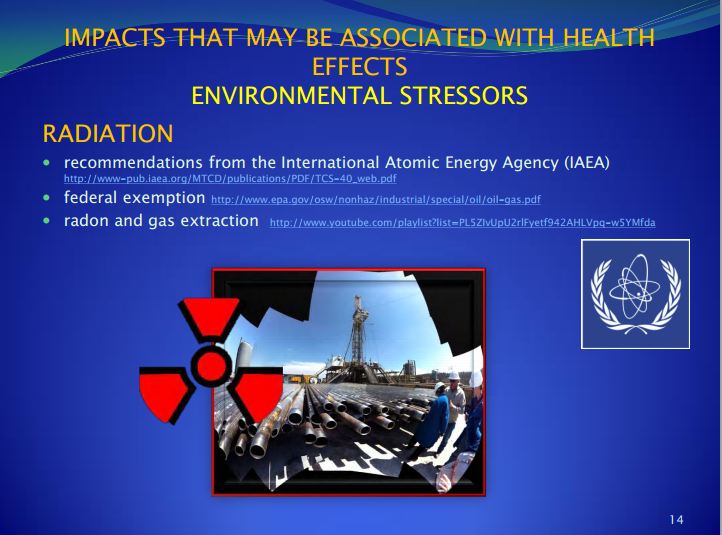
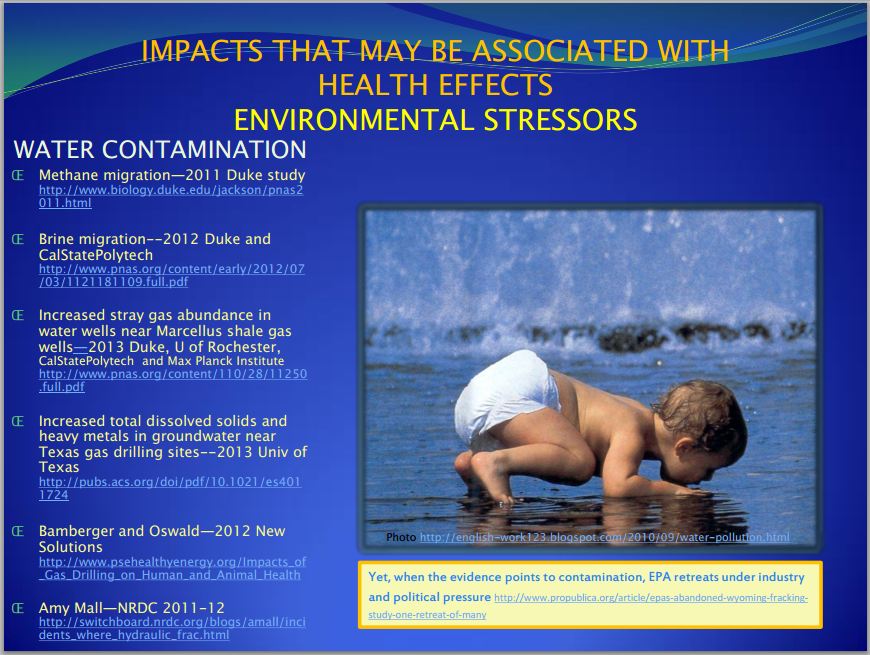

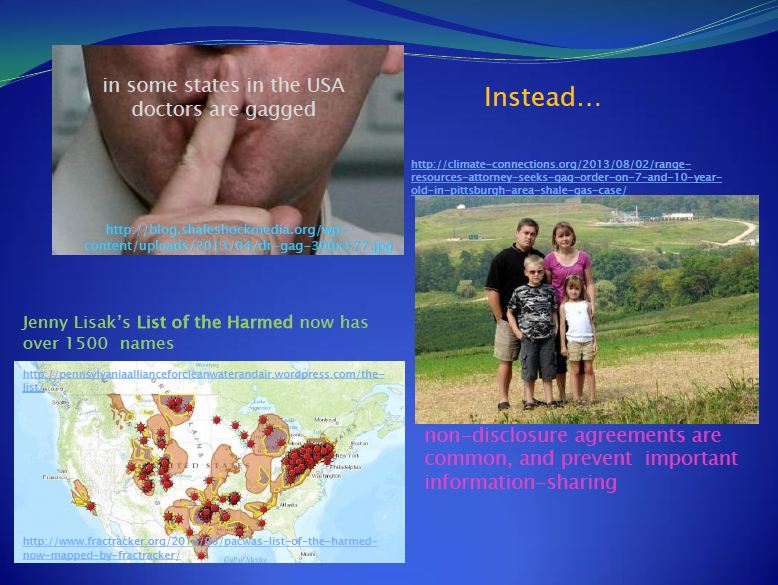
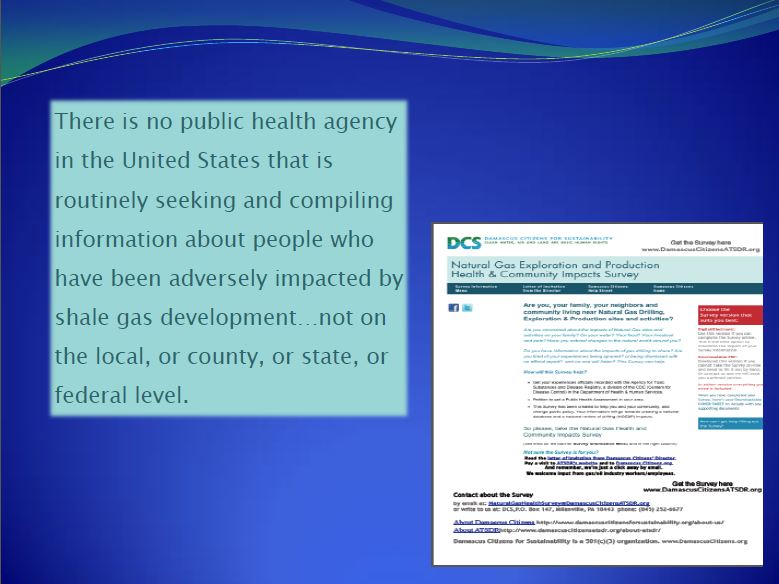
Slides above by Larysa Dyrszka MD, September 2013