
Suicide Rates by Industry and Occupation — National Violent Death Reporting System, 32 States, 2016 by Peterson C, Sussell A, Li J, Schumacher PK, Yeoman K, and Stone DM, Weekly / January 24, 2020 / 69(3);57–62, Centres for Disease Control and Prevention
MMWR Morb Mortal Wkly Rep 2020;69:57–62. DOI: http://dx.doi.org/10.15585/mmwr.mm6903a1external icon.
Summary
What is already known about this topic?
Suicide among the U.S. working-age population (ages 16–64 years) is increasing; in 2017, nearly 38,000 persons died by suicide.
What is added by this report?
National Violent Death Reporting System data from 32 states were used to calculate suicide rates for major industry and occupational groups and detailed occupational groups. Five industry groups and six major occupational groups had higher suicide rates than did the overall study population. Suicide rates for detailed occupational groups provide insight into subcategories within major groups.
What are the implications for public health practice?
Opportunities exist for targeted and broadscale prevention. CDC’s Preventing Suicide: A Technical Package of Policy, Programs, and Practices provides strategies to prevent suicide and can serve as a resource for communities and employers.
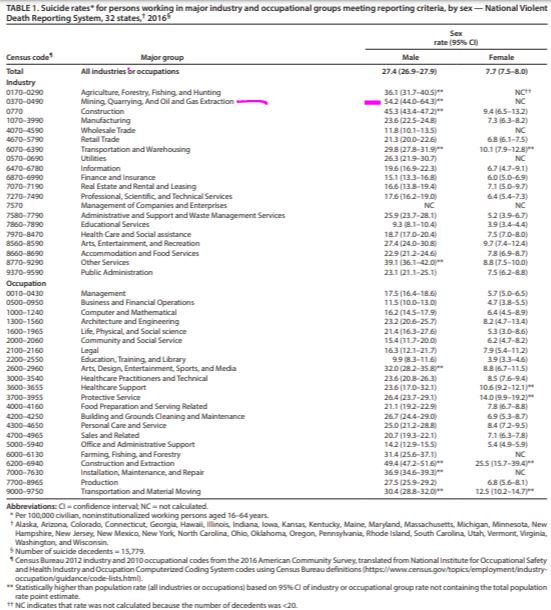
Table 1
In 2017, nearly 38,000 persons of working age (16–64 years) in the United States died by suicide, which represents a 40% rate increase (12.9 per 100,000 population in 2000 to 18.0 in 2017) in less than 2 decades.* To inform suicide prevention, CDC analyzed suicide data by industry and occupation among working-age decedents presumed to be employed at the time of death from the 32 states participating in the 2016 National Violent Death Reporting System (NVDRS).†,§
Compared with rates in the total study population, suicide rates were significantly higher in five major industry groups: 1) Mining, Quarrying, and Oil and Gas Extraction (males); 2) Construction (males); 3) Other Services (e.g., automotive repair) (males); 4) Agriculture, Forestry, Fishing, and Hunting (males); and 5) Transportation and Warehousing (males and females).
Rates were also significantly higher in six major occupational groups: 1) Construction and Extraction (males and females); 2) Installation, Maintenance, and Repair (males); 3) Arts, Design, Entertainment, Sports, and Media (males); 4) Transportation and Material Moving (males and females); 5) Protective Service (females); and 6) Healthcare Support (females). Rates for detailed occupational groups (e.g., Electricians or Carpenters within the Construction and Extraction major group) are presented and provide insight into the differences in suicide rates within major occupational groups. CDC’s Preventing Suicide: A Technical Package of Policy, Programs, and Practices (1) contains strategies to prevent suicide and is a resource for communities, including workplace settings.
NVDRS combines data on violent deaths, including suicide, from death certificates, coroner/medical examiner reports, and law enforcement reports. Industry and occupation coding experts used CDC’s National Institute for Occupational Safety and Health Industry and Occupation Computerized Coding System (NIOCCS 3.0)¶ to assign 2010 U.S. Census civilian industry and occupation codes for 20,975 suicide decedents aged 16–64 years from the 32 states participating in the 2016 NVDRS, using decedents’ usual industry and occupation as reported on death certificates. Industry (the business activity of a person’s employer or, if self-employed, their own business) and occupation (a person’s job or the type of work they do) are distinct ways to categorize employment (2).
Suicide rates were analyzed for industry and occupational groups by sex. Population counts by occupation for rate denominators were states’ civilian, noninstitutionalized current job population counts (for persons aged 16–64 years) from the 2016 American Community Survey Public Use Microdata Sample.** Replicate weight standard errors for those counts were used to calculate 95% confidence intervals (CIs) for suicide rates (3). Rates were calculated by U.S. Census code for major industry groups, major occupational groups, and detailed occupational groups with ≥20 decedents; detailed occupational groups are typically more homogenous in terms of employee income, work environment, and peer group. Rates were not calculated for detailed industry groups because many decedents’ industry was classifiable only by major group. The following decedents were excluded from rate calculations: military workers (327); unpaid workers (2,863); those whose other NVDRS data sources (e.g., law enforcement reports) indicated no employment at time of death (i.e., unemployed, disabled, incarcerated, homemaker, or student) (4) (1,783); and those not residing in the analysis states (223). A total of 15,779 decedents, including 12,505 (79%) males and 3,274 (21%) females, were included in the analysis. The analysis was conducted using Stata (version 15, StataCorp) and SAS (version 9.4, SAS Institute) statistical software.
Industry and occupational groups with suicide rates significantly (α = 0.05) higher than the study population (i.e., all industries or occupations: 27.4 males [95% CI = 26.9–27.9] and 7.7 females [95% CI = 7.5–8.0] per 100,000 population) were identified when the group’s 95% CI exceeded the study population rate point estimate. Treating the population rate as a constant is reasonable when variance is small and is required for one-sample inference that recognizes the nonindependence of individual industry and occupation groups relative to the study population.
The five major industry groups with suicide rates higher than the study population by sex included 1) Mining, Quarrying, and Oil and Gas Extraction (males: 54.2 per 100,000 civilian noninstitutionalized working population, 95% CI = 44.0–64.3); 2) Construction (males: 45.3, 95% CI = 43.4–47.2); 3) Other Services (e.g., automotive repair; males: 39.1, 95% CI = 36.1–42.0); 4) Agriculture, Forestry, Fishing, and Hunting (males: 36.1, 95% CI = 31.7–40.5); and 5) Transportation and Warehousing (males: 29.8, 95% CI = 27.8–31.9; females: 10.1, 95% CI = 7.9–12.8) (Table 1) (Supplementary Table 1, https://stacks.cdc.gov/view/cdc/84274). The six major occupational groups with higher rates included 1) Construction and Extraction (males: 49.4, 95% CI = 47.2–51.6; females: 25.5, 95% CI = 15.7–39.4); 2) Installation, Maintenance, and Repair (males: 36.9, 95% CI = 34.6–39.3); 3) Arts, Design, Entertainment, Sports, and Media (males: 32.0, 95% CI = 28.2–35.8); 4) Transportation and Material Moving (males: 30.4, 95% CI = 28.8–32.0; females: 12.5, 95% CI = 10.2–14.7); 5) Protective Service (females: 14.0, 95% CI = 9.9–19.2); and 6) Healthcare Support (females: 10.6, 95% CI = 9.2–12.1).
Rates could be calculated for 118 detailed occupational groups for males and 32 for females (Supplementary Table 2, https://stacks.cdc.gov/view/cdc/84275). Some occupational groups with suicide rates significantly higher than those of the study population were only identifiable through observation at the detailed group level (Table 2). Among males, these detailed groups included the following seven groups: 1) Fishing and hunting workers (part of the Farming, Fishing, and Forestry major occupational group); 2) Machinists (Production major group); 3) Welding, soldering, and brazing workers (Production major group); 4) Chefs and head cooks (Food Preparation and Serving Related major group); 5) Construction managers (Management major group); 6) Farmers, ranchers, and other agricultural managers (Management major group); and 7) Retail salespersons (Sales and Related major group). Among females, these detailed groups included the following five groups: 1) Artists and related workers (Arts, Design, Entertainment, Sports, and Media major group); 2) Personal care aides (Personal Care and Service major group); 3) Retail salespersons (Sales and Related major group); 4) Waiters and waitresses (Food Preparation and Serving Related major group); and 5) Registered nurses (Healthcare Practitioners and Technical major group). Groups with highest rate point estimates (e.g., female Artists and related workers and male Fishing and hunting workers) also had wide 95% CIs (Table 2), based on relatively low numbers of decedents and relatively small working populations (Supplementary Table 2, https://stacks.cdc.gov/view/cdc/84275).
Discussion
This report used data from 32 states to provide updated population-level suicide rates for major occupational groups and new information on suicide rates for major industry groups and detailed occupational groups. Estimates for most major occupational groups are similar, although not directly comparable, to previous estimates that were based on 2015 NVDRS data from 17 states (4). Recent NVDRS expansion to 50 states might facilitate direct comparisons over time by industry and occupation nationwide. These findings highlight opportunities for targeted prevention strategies and further investigation of work-related factors that might increase risk of suicide. Previous research indicates suicide risk is associated with low-skilled work (5), lower education (6), lower absolute and relative socioeconomic status (7), work-related access to lethal means (8), and job stress, including poor supervisory and colleague support, low job control, and job insecurity (9). Industry, labor, and professional associations, as well as employers, and state and local health departments can use this information to focus attention and resources on suicide prevention. Future research might examine these and other risk factors among the industries and occupations identified in this report as having high suicide rates.
This report estimated suicide rates comprehensively for industry and occupational groups meeting sample size criteria and identified groups with rates higher than the study’s population rate. Although relative comparisons of suicide rates in this manner are useful for prevention purposes, these results should not overshadow the essential fact that the suicide rate in the U.S. working-age population overall has increased by 40% in less than 2 decades. Therefore, all industry sectors and occupational groups can contribute to reducing suicide incidence.
The findings in this report are subject to at least five limitations. First, this study did not address confounding factors that might account for different suicide rates among and within industry or occupational groups. Second, it did not address suicide among unemployed decedents, military or unpaid workers, or those aged >64 years (9). Third, the numerator and denominator data were not a direct match for calculating rates; death certificates reflect decedents’ usual industry and occupation, and available population size data refer to the number of persons by current job. Fourth, the results are based on data from 32 states and are therefore not nationally representative. Finally, three states contributing to the 2016 NVDRS did not collect data on all violent deaths. Other limitations of NVDRS analysis using death certificate industry and occupation data have been described previously (4).
All industries and occupations can benefit from a comprehensive approach to suicide prevention. CDC’s Preventing Suicide: A Technical Package of Policy, Programs, and Practices (1) provides strategies with the best available evidence to prevent suicide and can serve as a resource for communities and employers. Workplace-specific strategies include 1) promoting help-seeking; 2) integrating workplace safety and health and wellness programs to advance the overall well-being of workers; 3) referring workers to financial and other helping services; 4) facilitating time off and benefits to cover supportive services; 5) training personnel to detect and appropriately respond to suicide risk; 6) creating opportunities for employee social connectedness; 7) reducing access to lethal means among persons at risk; and 8) creating a crisis response plan sensitive to the needs of coworkers, friends, family, and others who might themselves be at risk (1,10). Other community-based strategies include strengthening economic supports, strengthening access and delivery of care, teaching coping and problem-solving skills, and responsibly reporting suicide (e.g., not providing details) (1). Further workplace prevention resources are available at https://workplacesuicideprevention.com/external icon and https://theactionalliance.org/communities/workplaceexternal icon and help is available at 1-800-273-TALK (8255).
Acknowledgments
Susan Burton, Matt Hirst, Jeff Purdin, Marie Haring Sweeney, Division of Field Studies and Engineering, National Institute for Occupational Safety and Health, CDC; the 32 states that added industry and occupation data to the 2016 National Violent Death Reporting System.
Corresponding author: Cora Peterson, email hidden; JavaScript is required, 770-488-0699.
1Division of Injury Prevention, National Center for Injury Prevention and Control, CDC; 2Spokane Mining Research Division, National Institute for Occupational Safety and Health, CDC; 3Division of Field Studies and Engineering, National Institute for Occupational Safety and Health, CDC.
All authors have completed and submitted the International Committee of Medical Journal Editors form for disclosure of potential conflicts of interest. No potential conflicts of interest were disclosed.
* https://www.cdc.gov/injury/wisqars.
† https://www.cdc.gov/violenceprevention/nvdrs.
§ In 2016, 32 states participated in NVDRS: Alaska, Arizona, Colorado, Connecticut, Georgia, Hawaii, Illinois, Indiana, Iowa, Kansas, Kentucky, Maine, Maryland, Massachusetts, Michigan, Minnesota, New Hampshire, New Jersey, New Mexico, New York, North Carolina, Ohio, Oklahoma, Oregon, Pennsylvania, Rhode Island, South Carolina, Utah, Vermont, Virginia, Washington, and Wisconsin. That year, Illinois, Pennsylvania, and Washington each collected data on ≥80% of violent deaths in the state, in accordance with requirements under which the state was funded for NVDRS; therefore, presented data likely underestimate suicide deaths and rates.
¶ https://wwwn.cdc.gov/nioccs3.
** https://www.census.gov/programs-surveys/acs/data/pums.htmlexternal icon.
References
- Stone DM, Holland K, Bartholow B, Crosby A, Davis S, Wilkins N. Preventing suicide: a technical package of policies, programs, and practices. Atlanta, GA: US Department of Health and Human Services, CDC, National Center for Injury Prevention and Control; 2017. https://www.cdc.gov/violenceprevention/pdf/suicideTechnicalPackage.pdfpdf icon
- US Bureau of Labor Statistics. Labor force statistics from the current population survey: concepts and definitions. Washington, DC: US Department of Labor, US Bureau of Labor Statistics; 2018. https://www.bls.gov/cps/definitions.htm#occupationexternal icon
- National Center for Health Statistics. Vital statistics of the United States: mortality, 1999 technical appendix. Hyattsville, MD: US Department of Health and Human Services, CDC, National Center for Health Statistics; 2004. https://www.cdc.gov/nchs/data/statab/techap99.pdfpdf icon
- Peterson C, Stone DM, Marsh SM, et al. Suicide rates by major occupational group—17 states, 2012 and 2015. MMWR Morb Mortal Wkly Rep 2018;67:1253–60. CrossRefexternal icon PubMedexternal icon
- Milner A, Spittal MJ, Pirkis J, LaMontagne AD. Suicide by occupation: systematic review and meta-analysis. Br J Psychiatry 2013;203:409–16. CrossRefexternal icon PubMedexternal icon
- Phillips JA, Hempstead K. Differences in U.S. suicide rates by educational attainment, 2000–2014. Am J Prev Med 2017;53:e123–30. CrossRefexternal icon PubMedexternal icon
- Daly MC, Wilson DJ, Johnson NJ. Relative status and well-being: evidence from U.S. suicide deaths. Rev Econ Stat 2013;95:1480–500. CrossRefexternal icon
- Milner A, Witt K, Maheen H, LaMontagne AD. Access to means of suicide, occupation and the risk of suicide: a national study over 12 years of coronial data. BMC Psychiatry 2017;17:125. CrossRefexternal icon PubMedexternal icon
- Milner A, Witt K, LaMontagne AD, Niedhammer I. Psychosocial job stressors and suicidality: a meta-analysis and systematic review. Occup Environ Med 2018;75:245–53. CrossRefexternal icon PubMedexternal icon
- Milner A, Page K, Spencer-Thomas S, Lamotagne AD. Workplace suicide prevention: a systematic review of published and unpublished activities. Health Promot Int 2015;30:29–37. CrossRefexternal icon PubMedexternal icon
… All HTML versions of MMWR articles are gene rated from final proofs through an automated process. This conversion might result in character translation or format errors in the HTML version. Users are referred to the electronic PDF version (https://www.cdc.gov/mmwr) and/or the original MMWR paper copy for printable versions of official text, figures, and tables.
Questions or messages regarding errors in formatting should be addressed to email hidden; JavaScript is required.
Refer also to: